DASHBOARDS & REPORTS
Monitor business finances and team productivity
Get a detailed view of your productivity, sales, profitability, and other key financial metrics through insightful charts and in-depth reports.
START WITH ELORUS FOR FREE

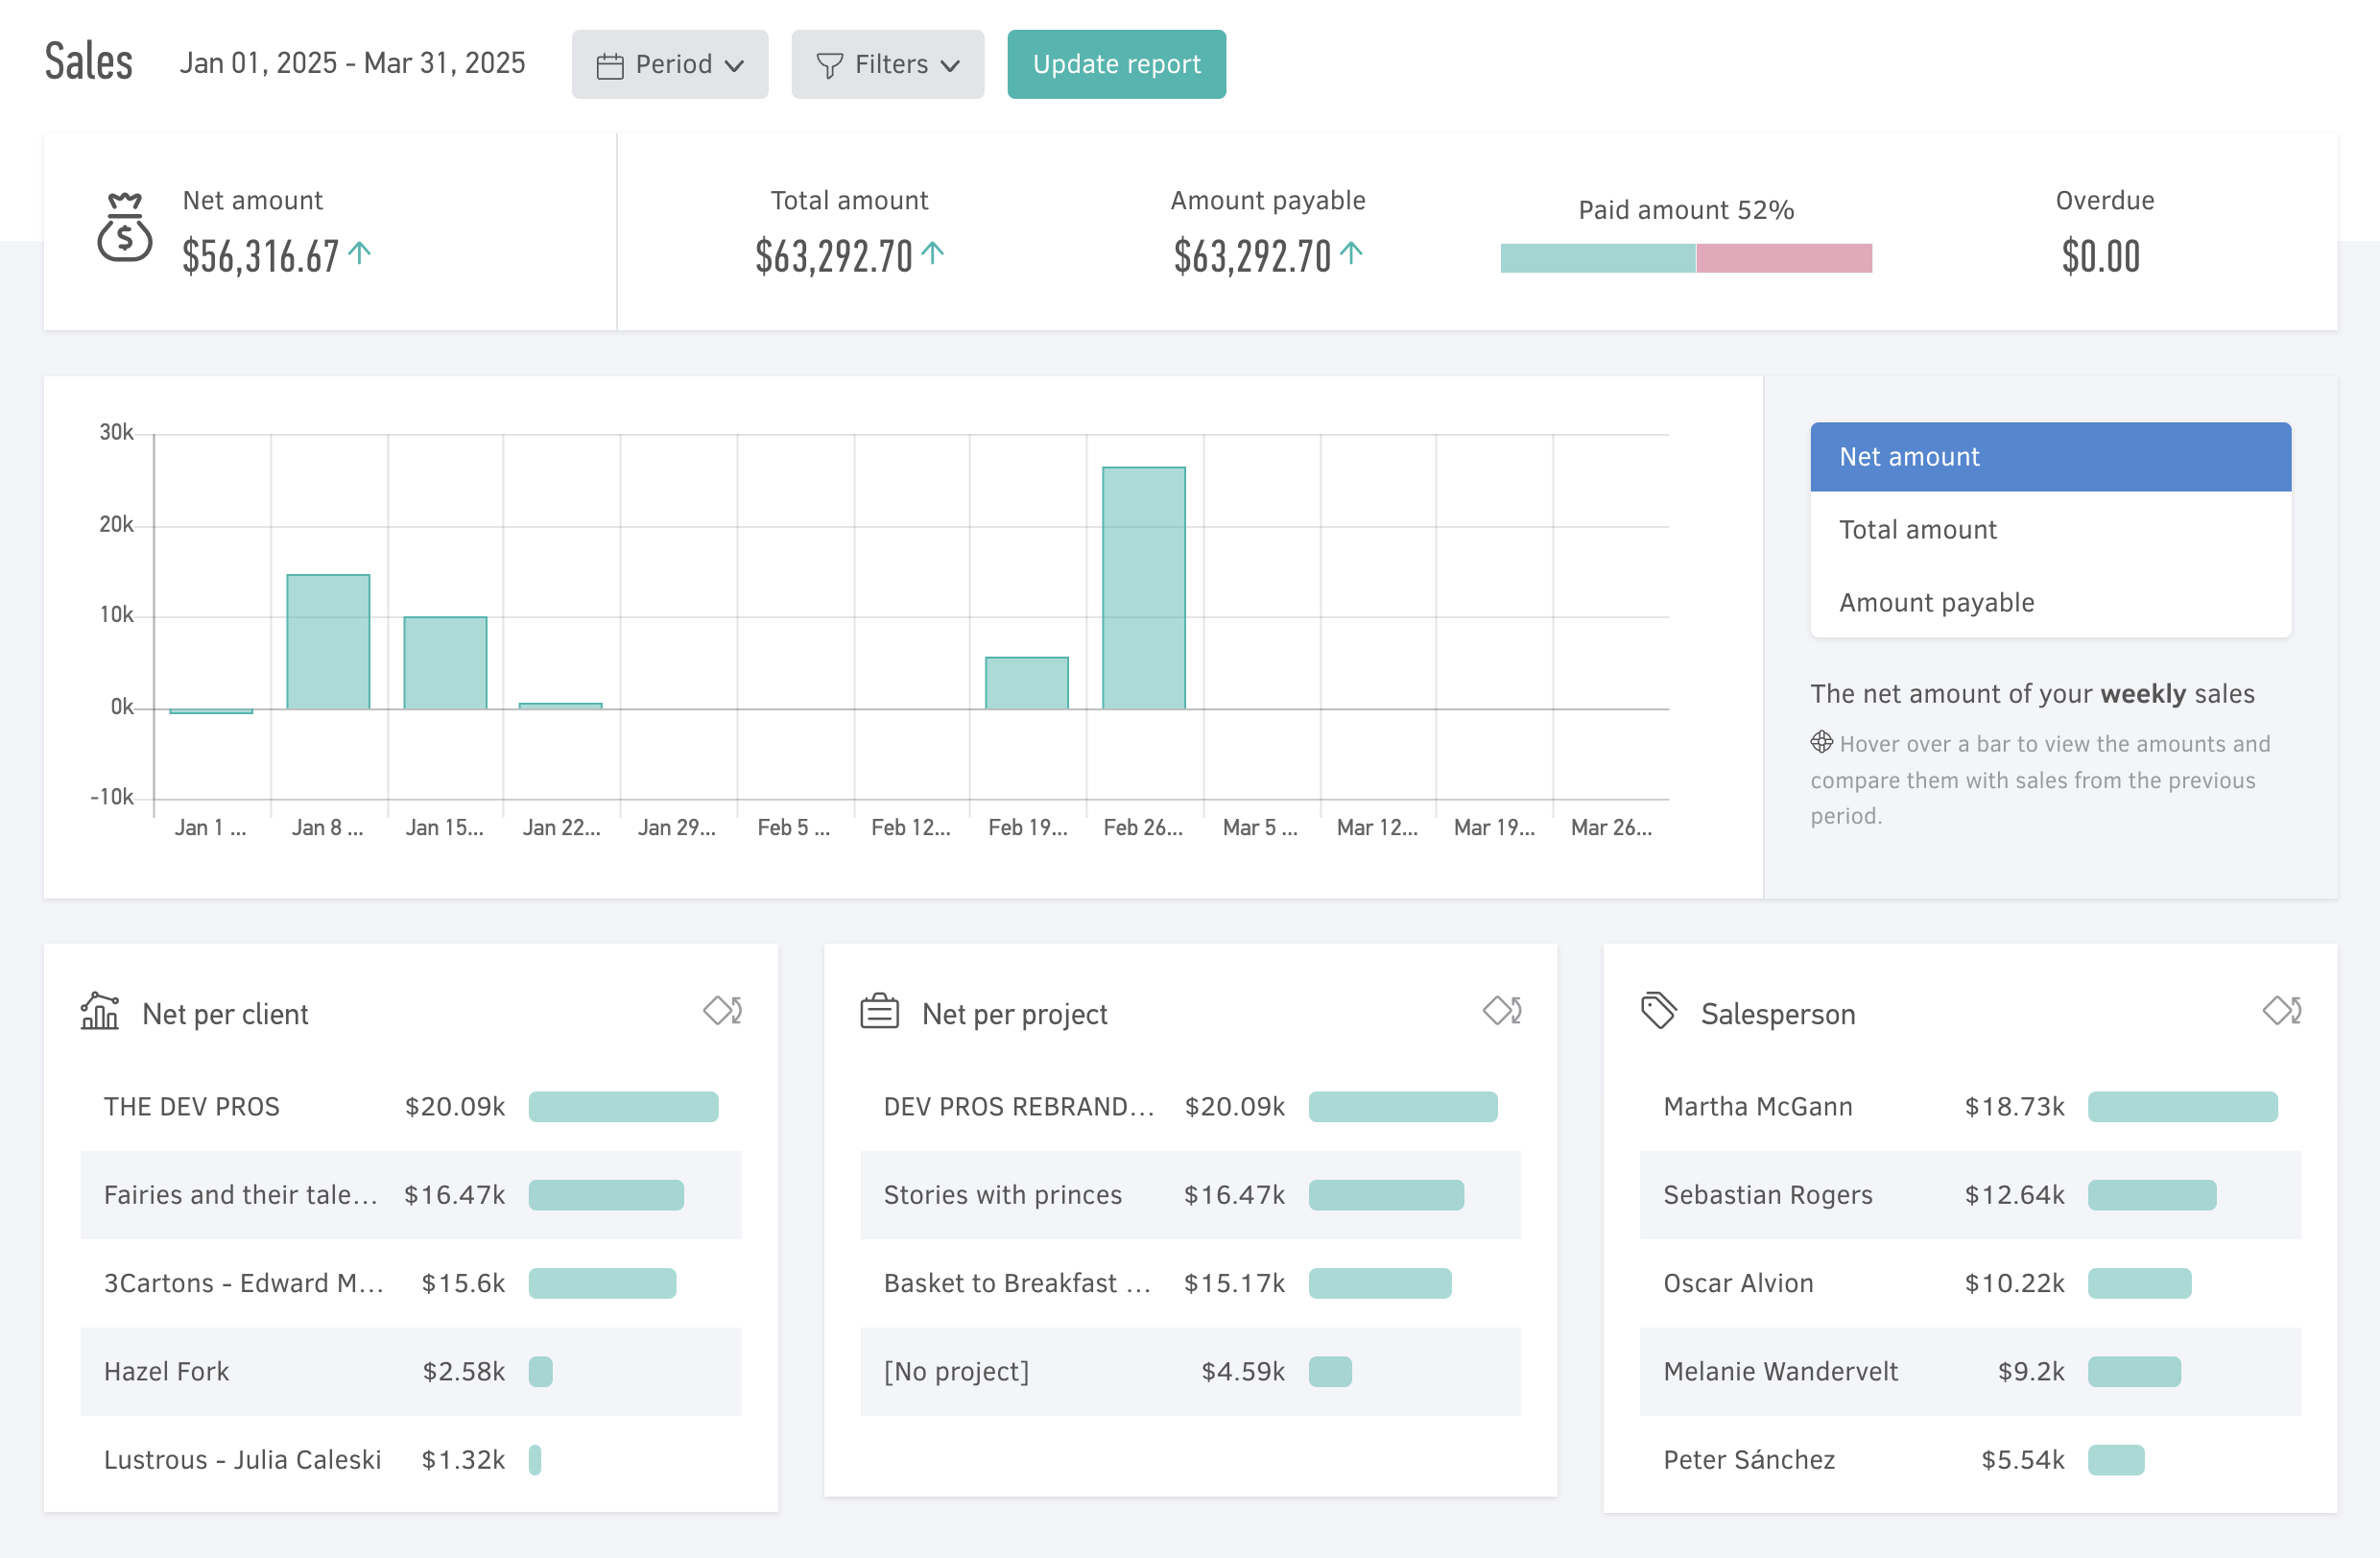
Monitor total business sales, daily sales breakdowns by client, project, or salesperson, outstanding client balances, and overdue payments.
Compare sales performance against previous periods and quickly identify your most profitable areas.
Get a clear picture of how your business expenses are distributed. Monitor total expenses, supplier balances, spending per project or supplier, overdue payments, and more.
Compare current expenses against previous periods, identify major expense areas, and focus on cost-saving opportunities.
With Elorus, I have a grip on the company’s financial data in a user-friendly and aesthetically pleasing interface. Simultaneously, I extract vital reports on productivity and the KPIs we’ve established as a company.
Maria Vorylla
Managing Director - Denovo Hellas
Track each user’s logged work hours per project, task, or client to evaluate your team’s performance.
Break down total tracked time, hourly project costs, and identify clients with high non-billable hours.
For deeper financial insights, create fully customizable reports tailored to your needs.
Add or remove columns, group data, and export reports for Revenue, Expenses, Time, Projects, Cash Flow, and Accounting in Excel or PDF format.